

Does Olymp Trade Work in India? A Clear Guide
Discover if Olymp Trade is legal and reliable in India 🇮🇳. Learn about its features, payment options, risks, and user feedback for Indian traders before you start.
Edited By
Amelia Hughes
Choosing the right indicator for trading on Olymp Trade can significantly improve your decision-making and overall returns. Traders often get overwhelmed by the sheer number of options available — from trend-following to oscillators and volume-based indicators. Each serves a different purpose, so understanding what fits your trading style and the current market conditions is key.
Indicators are tools that process price and volume data to give insights into potential market direction, momentum, or trend strength. However, relying on a single indicator rarely works well. Combining complementary indicators can provide a clearer picture and reduce false signals. For example, pairing a moving average convergence divergence (MACD) indicator with the Relative Strength Index (RSI) helps confirm momentum shifts and potential reversals.
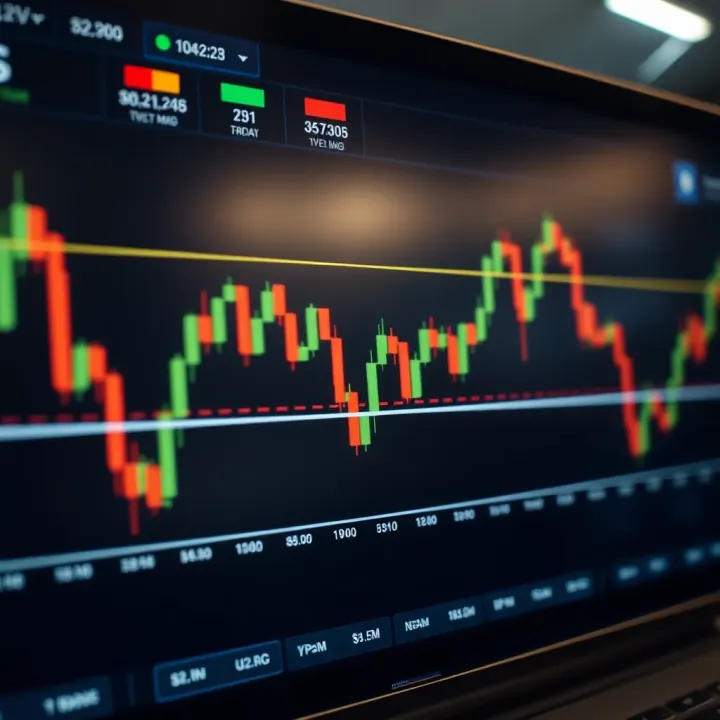
Remember, no indicator guarantees profits. They provide probabilities, not certainties. Use indicators as part of a broader strategy, including risk management and market awareness.
For Indian traders using Olymp Trade, aligning indicators with the asset type and trading horizon makes a difference. Short-term scalping demands fast-reacting indicators like Stochastics or RSI, while long-term positions might benefit from moving averages or Ichimoku Clouds that highlight broader trends. Also, consider the market you trade — currency pairs, indices, or commodities each behave differently, so a one-size-fits-all approach seldom works.
When selecting indicators, focus on:
Purpose: Are you looking to identify trend direction, momentum, volatility, or volume?
Complexity: Some indicators need fine-tuning to your chart’s timeframe, while others work well out of the box.
Complementarity: Avoid using multiple indicators that offer the same signals; instead, combine those that provide distinct information.
The practical takeaways for Olymp Trade users:
Start with one or two indicators and test their effectiveness on demo accounts.
Adjust their parameters based on the specific asset and timeframe.
Combine indicators thoughtfully — for example, trend indicators like moving averages with oscillators like RSI.
This guide will help you navigate these choices and create a balanced indicator setup tailored to your trading style on Olymp Trade.
Technical indicators form the backbone of effective trading on Olymp Trade. These tools help traders interpret market behaviour by transforming raw price data into actionable insights. Without understanding these indicators, navigating the markets can feel like sailing without a compass, especially for those trading in volatile environments such as Indian stock and currency markets.
Trading indicators are mathematical calculations applied to price, volume, or open interest data to forecast future market movements. Their main purpose is to highlight trends, momentum, volatility, or market strength, which aren't always obvious from looking at prices alone. For example, a trader might use an indicator to spot when a price is likely to reverse after a period of steady movement.
By using indicators, traders gain a structured way to analyse the markets instead of relying on guesswork or emotions. For instance, in Indian markets where sudden policy announcements or global news can trigger sharp moves, indicators can provide early warning signals to adjust positions. This makes them practical tools to manage risk and improve decision-making.
Indicators simplify complex market data into easy-to-understand signals like 'buy', 'sell', or 'hold'. They reduce the noise that often clouds judgement by spotlighting meaningful price action or momentum shifts. For example, the Relative Strength Index (RSI) helps traders identify when a security is overbought or oversold, flagging potential entry or exit points.
On Olymp Trade, combining multiple indicators can give a clearer picture. A momentum indicator might confirm the strength of a trend identified by a trend indicator. This approach helps avoid false signals and supports more confident trade choices, which is especially valuable when trading intraday or during volatile sessions.
Trend indicators track the general direction of prices over time, helping traders find out if the market is moving up, down, or sideways. Moving averages are classic examples that smooth price data to reveal trends more clearly. For a trader in India focusing on the Nifty 50 index, trend indicators can clarify whether to follow the broader market's direction or wait for a reversal.
Momentum indicators measure the speed or strength of price movement. They are useful to detect how powerful a trend is before making a trading decision. For instance, if a momentum indicator shows weakening strength despite rising prices, it could signal a coming correction in stocks like Reliance Industries.
Volume indicators assess trading activity by measuring the number of assets traded in a specific period. High volume often confirms the validity of a price move. In Indian markets, where volume surges sometimes accompany big news events, these indicators help verify if a trend has real backing or is likely to fizzle out.
Volatility indicators quantify how much price fluctuates over time. They guide traders on the expected risk and can inform position sizing. When trading volatile instruments like cryptocurrency pairs or fast-moving stocks on Olymp Trade, volatility indicators such as Bollinger Bands provide clues on whether prices are likely to swing widely or stay calm.
Understanding these indicators' roles prepares you to use Olymp Trade effectively, tailoring your strategy to market conditions and your trading style.
This knowledge helps build a foundation for selecting suitable indicators that fit your individual needs and enhances your chances of consistent profits.
Understanding popular indicators helps traders on Olymp Trade make smarter decisions by providing insights into market direction and momentum. These tools are widely used because they offer clear signals that fit different trading styles—from scalping to swing trading—making them a practical choice for many Indian traders adapting to dynamic market movements.
Simple Moving Average (SMA) calculates the average price over a specific period, smoothing out short-term fluctuations. For instance, a 20-day SMA sums up closing prices for the last 20 days and divides by 20. This helps identify overall trend direction, which is crucial when deciding whether to enter or exit positions.
Exponential Moving Average (EMA) gives more weight to recent prices, making it more responsive to current market changes. Compared to SMA, EMA reacts quicker to price shifts, which traders favour for spotting early trend reversals or momentum changes, especially in fast-moving markets.
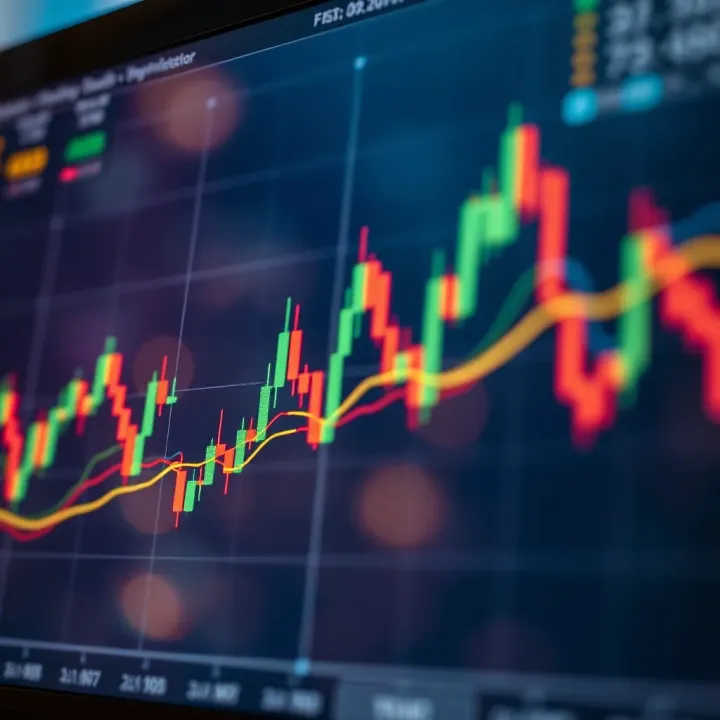
Application in Olymp Trade typically involves using moving averages to confirm trends or signal entry points. For example, traders might watch for a crossover—when a short-term EMA crosses above a longer-term SMA—as a buy signal. These averages also act as dynamic support or resistance levels, guiding trade exits or stop-loss placements.
How RSI measures momentum: RSI quantifies the speed and change of price movements on a scale of 0 to 100. It evaluates average gains versus losses over a set period, indicating whether an asset’s momentum is strong or weakening. This measure helps traders identify buying or selling pressure.
Using RSI for overbought and oversold signals is common on Olymp Trade. An RSI above 70 suggests the asset is overbought and may soon see a price correction, while below 30 indicates oversold conditions and potential price bounce. Indian traders often use this to time entries and exits, especially during volatile market phases.
Understanding volatility with Bollinger Bands involves measuring price volatility by plotting bands above and below a moving average. The bands widen when volatility spikes and contract during quiet periods, helping traders gauge market activity.
Trading signals from price interaction with bands include price touching or crossing beyond the upper band, which may signal overextension, or approaching the lower band, indicating possible support. Olymp Trade users leverage these signals to anticipate reversals or continuations.
Components of MACD include the MACD line (difference between two EMAs), the signal line (EMA of the MACD line), and the histogram (difference between MACD and signal). This setup helps quantify momentum and trend strength.
Using MACD for trend changes and momentum means watching for crossovers between the MACD and signal lines. A bullish crossover might suggest a buying opportunity, while a bearish crossover could warn of a downturn. The histogram’s height changes also provide clues on momentum shifts, helping traders fine-tune their decisions.
Mastering these popular indicators can greatly enhance your trading edge on Olymp Trade, especially when combined thoughtfully to fit your style and the Indian market’s volatility.
Selecting the right indicators hinges directly on your trading approach and the time frame you operate in. Not every indicator suits every style, and using the wrong tool can cloud your judgement rather than clear it. Tailoring indicators to your trading strategy helps focus on relevant signals, reducing noise and improving decision-making.
Scalping and short-term trading demand indicators that quickly reflect price changes. Since scalping typically involves holding positions for just seconds or minutes, traders often lean on fast-moving averages like the Exponential Moving Average (EMA) with short periods or momentum indicators such as the Relative Strength Index (RSI) set to shorter time frames. These help spot rapid entry and exit points in volatile markets like indices or currency pairs during active hours.
On the other hand, swing trading covers several days or weeks and benefits from indicators capturing medium-term trends. Traders may combine moving averages with oscillators like MACD (Moving Average Convergence Divergence) to confirm trend strength and potential reversals. For example, a trader on Olymp Trade might watch for MACD crosses alongside a 20-day SMA to decide on holding or exiting a position.
For those focused on a long-term investment approach, indicators smoothing out short-term fluctuations work best. Using Simple Moving Averages (SMA) over longer durations, such as 50 or 200 days, helps identify overall market direction. Trend indicators paired with volume indicators can confirm sustained interest in an asset, especially when investing in stocks or commodities over months.
Adding too many indicators often leads to contradictory signals, confusing rather than aiding a trader. It's vital to avoid conflicting signals by choosing indicators measuring different aspects — for example, pairing a trend indicator like Moving Average with a momentum indicator such as RSI. They complement each other instead of sending mixed messages.
Overcrowding your chart can dilute focus; stick to two or three well-chosen indicators that align with your trading style.
Best practices for combining indicators involve selecting those that provide unique insights without redundancy. For instance, combining Bollinger Bands (volatility) with MACD (momentum) offers a fuller picture of price action without overlap. Testing combinations on a demo account before applying them live prevents confusion and builds confidence.
By aligning indicators with your trading timeframe and strategy, and avoiding overloading charts, you sharpen your edge on Olymp Trade. It’s about quality signals, not quantity.
Using trading indicators effectively on Olymp Trade demands more than just picking popular tools. Practical tips help traders tune indicators to fit market realities, avoid common pitfalls, and build confidence through demo practice. These pointers are especially important for Indian traders facing unique market volatility and trading hours.
Indicators like Moving Averages or RSI rely on time frames to signal trends or momentum. In Indian markets, adjusting these periods matters because market activity peaks during certain hours, such as the first hour post-opening of NSE or BSE. For example, shortening the RSI period from 14 to 7 may capture quicker momentum shifts when trading volatile stocks like Tata Motors or Reliance Industries.
Sensitivity tuning also helps in filtering false signals Commonly, a default setting might not suit the fast-moving nature of intraday trades during earnings seasons. Therefore, tweak parameters according to the asset and trading style.
Indian equity markets can swing sharply due to events like RBI monetary policy announcements or global cues affecting the Sensex and Nifty. Indicators like Bollinger Bands must have band widths adjusted to reflect this fluctuation. Wider bands can account for increased volatility during monsoon quarters when FMCG stocks often react strongly to rainfall data.
Traders should observe typical price ranges in live trades and adjust indicator parameters accordingly, avoiding one-size-fits-all settings that might produce misleading signals in choppy markets.
Indicators are calculated using past price data and cannot predict sudden news-driven moves, such as a surprise GST rate cut or an unexpected Cabinet decision impacting sectors. Relying only on indicators may cause missed opportunities or losses. Combining indicators with price action analysis or volume trends improves decision-making accuracy.
For instance, an RSI signal might indicate oversold conditions, but if overall market sentiment is negative due to weak IIP data, it's wiser to wait.
Ignoring broader factors like earnings reports, geopolitical tensions, or currency movements can cause traders to misinterpret indicator signals. For example, a MACD crossover on Infosys stocks might suggest a buy, but if the IT sector faces headwinds from global tech slowdowns, risks increase.
Keeping track of economic calendars and news feeds alongside indicator signals helps place trades in context, reducing surprises.
Remember, indicators support decisions—they don’t replace scrutiny of what's happening in the market.
Demo accounts allow you to experiment with different indicators and settings without risking money. This practice is useful to understand indicator behaviour during high-volatility periods, such as Diwali or budget announcements, specific to Indian markets.
The real-time simulation helps traders build confidence and develop strategies compatible with their risk tolerance and trading styles before committing real funds.
Track key metrics such as the percentage of successful trades guided by the indicator, average profit-loss ratio, and rate of false signals. Maintaining a trading journal during demo sessions is crucial to assess what works best.
For example, if a combination of SMA and MACD shows reliable entry points on banking stocks but performs poorly on mid-cap shares, adjusting the approach is necessary.
Systematic testing through demo accounts sharpens your skills and prevents costly errors in live trading.
Choosing the right indicator on Olymp Trade is not a one-size-fits-all process. It depends heavily on your trading style, market conditions, and personal preferences. This final section pulls together practical advice to help you make confident, informed decisions when selecting indicators that truly complement your trading approach.
Trading indicators can behave differently across markets and timeframes, so it’s wise to experiment before committing. For instance, a moving average might work well for your swing trades but lag too much during short-term scalping. Testing indicators in a demo account with different settings can reveal which tools give clearer signals for your style. This hands-on learning helps avoid blindly following popular indicators without understanding their impact on your trades.
Markets evolve, and so should your indicator choices. What works during stable market phases may fail in high volatility or during major events like budget announcements. Keeping track of indicator performance and staying updated with new strategies is crucial. Many successful traders review their indicator setups regularly, tweaking parameters or adding new tools based on recent market behaviour. This way, you stay flexible and prepared for changing conditions.
Olymp Trade offers a range of tutorials, webinars, and articles tailored for different experience levels. These resources explain how each indicator functions and how to apply them effectively. Leveraging such official materials can speed up your learning curve and provide you with tested methods specifically designed for the platform’s features. For example, you might find detailed guides on optimising RSI settings for the Indian market, which reflects local volatility patterns.
Engaging with other traders in Indian online forums or Telegram groups provides real-time insights and shared experiences. These communities often discuss which indicators perform best during monsoon season market swings or how GST updates impact price momentum. Such peer exchange offers practical tips you won’t get from official tutorials alone. Plus, asking questions and seeing diverse viewpoints can sharpen your trading sense, helping you choose indicators that fit your unique challenges.
Finding your best indicator is a dynamic process rooted in trial, adaptation, and learning. Use resources around you, practise consistently, and adjust as the market demands. This approach not only improves your Olymp Trade performance but also builds a stronger trading mindset.
Discover if Olymp Trade is legal and reliable in India 🇮🇳. Learn about its features, payment options, risks, and user feedback for Indian traders before you start.

Explore Qutex Trade in detail 📊 Understand its key features, trading methods, benefits, and risks 🔍 Perfect for traders in India aiming to get informed.

Explore Quotex Trade for Indian traders 🇮🇳—learn how to register, trade strategies, payment methods, risks, and tips for safe online binary options trading 💹

🔍 Explore real trade apps for quick market access, security tips, key features, and expert advice to pick the best app matching your trading goals in India.
Based on 12 reviews